
GE (General Electric) Model

 Understanding the General Electric (GE) Model: A Strategic Analysis Framework

Introduction:

The General Electric (GE) Model, also known as the GE-McKinsey Matrix or GE Nine Cell, is a strategic planning tool used to evaluate business units within a diversified company. Developed by McKinsey & Company in collaboration with General Electric, this model helps organizations assess the performance of their various business units and allocate resources effectively. In this blog post, we will explore the components of the GE Model and provide an industry example to illustrate its application.


Components of the GE Model:

The GE Model assesses business units based on two key dimensions: market attractiveness and business unit strength. Each dimension is further divided into several factors for evaluation.

  1. Market Attractiveness:

    • Market Size: The size of the market segment and its growth potential.
    • Market Growth Rate: The rate at which the market is expanding.
    • Market Profitability: The potential profitability of the market segment.
    • Competitive Intensity: The level of competition within the market.
  2. Business Unit Strength:

    • Competitive Position: The business unit's market share and competitive advantage.
    • Strength of Assets and Capabilities: The resources and capabilities of the business unit.
    • Industry Attractiveness: The attractiveness of the industry in which the business unit operates.
    • Profitability: The current and potential profitability of the business unit.

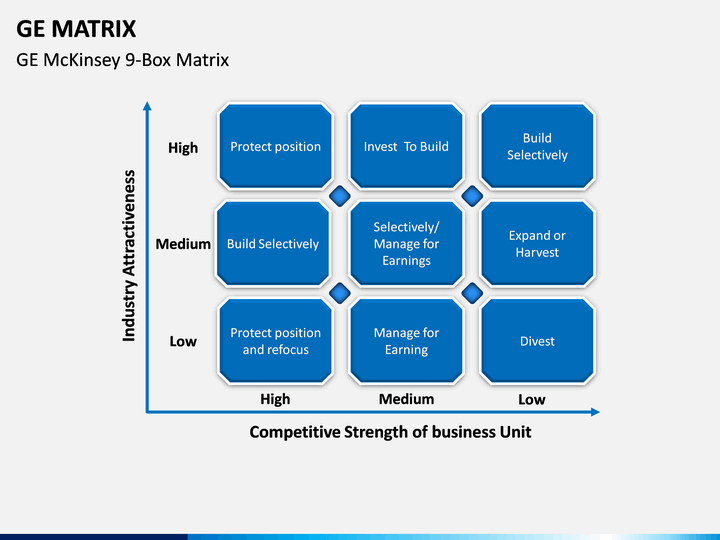
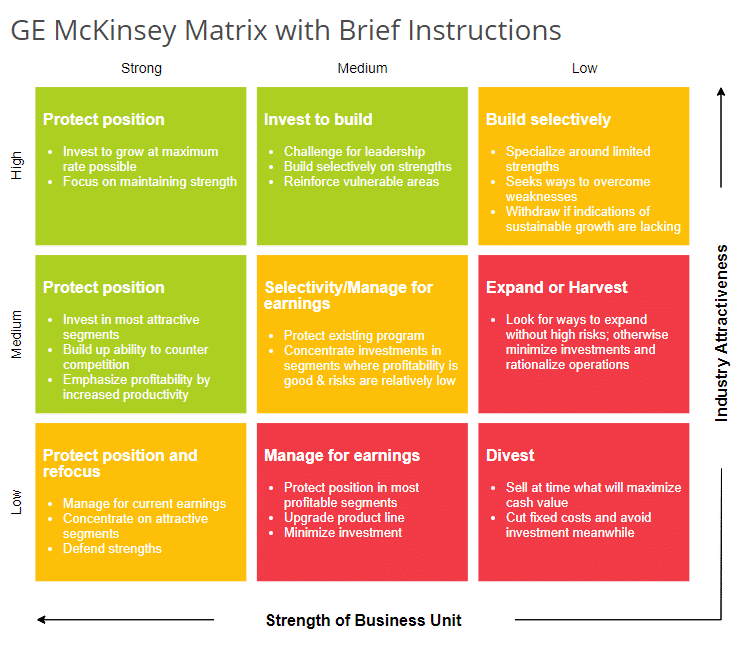
Description of the GE Model

The Green Zone consists of the three cells in the upper left corner. If your enterprise falls in this zone you are in a favorable position with relatively attractive growth opportunities. This indicates a "green light" to invest in this product/service.

The Yellow Zone consists of the three diagonal cells from the lower left to the upper right. A position in the yellow zone is viewed as having medium attractiveness. Management must therefore exercise caution when making additional investments in this product/service. The suggested strategy is to seek to maintain share rather than growing or reducing share.

The Red Zone consists of the three cells in the lower right corner. A position in the red zone is not attractive. The suggested strategy is that management should begin to make plans to exit the industry.


Doing What is Required to Be Done.

Green: Invest

Yellow: Protect

Red     : Harvest

Example from the Industry:

Let's consider the automobile industry and apply the GE Model to assess the performance of different car models offered by a hypothetical automobile company.

  1. Market Attractiveness:

    • Market Size: The SUV market segment is large and growing due to consumer demand for spacious and versatile vehicles.
    • Market Growth Rate: The SUV segment is experiencing rapid growth compared to other segments.
    • Market Profitability: SUVs tend to have higher profit margins compared to smaller car segments.
    • Competitive Intensity: The SUV market is highly competitive, with several established players and new entrants.
  2. Business Unit Strength:

    • Competitive Position: The company's flagship SUV model holds a significant market share and enjoys brand recognition.
    • Strength of Assets and Capabilities: The company has a strong reputation for manufacturing reliable and durable vehicles.
    • Industry Attractiveness: The overall automobile industry is experiencing moderate growth and profitability.
    • Profitability: The SUV business unit generates substantial profits for the company due to high demand and favorable margins.


Conclusion:

The General Electric (GE) Model provides a structured approach for assessing the performance and potential of business units within a diversified company. By evaluating market attractiveness and business unit strength, organizations can make informed decisions about resource allocation, investment priorities, and strategic direction. As demonstrated in the industry example, the GE Model offers valuable insights for companies seeking to optimize their portfolio of business units and drive sustainable growth.

Comments

Popular posts from this blog

Chapter 14: Brand Management: Building and Sustaining Brand Equity

  Brand Management: Building and Sustaining Brand Equity Introduction to Brand Management: Brand management is a strategic process that involves creating, maintaining, and enhancing the perception of a brand in the minds of consumers. It encompasses various activities aimed at building brand awareness, fostering positive brand associations, and ultimately driving brand loyalty and equity. Definition of a Brand: A brand is more than just a logo or a name; it represents the collective perception, emotions, and experiences associated with a product, service, or company. Brands convey a promise of quality, consistency, and value to consumers, distinguishing them from competitors in the marketplace. Example: Coca-Cola is not just a beverage; it's a globally recognized brand synonymous with happiness, refreshment, and iconic advertising campaigns. Brand Management: Brand management involves strategically managing all aspects of a brand's identity, image, and communication to create ...

Mckinsey 7-S framework

  Understanding the McKinsey 7-S Framework: A Comprehensive Guide with Examples Introduction: The McKinsey 7-S Framework is a management model developed by consulting firm McKinsey & Company to help organizations analyze and align their internal elements for effective performance. This framework identifies seven interconnected factors that are critical for organizational success. In this blog post, we will explore each element of the McKinsey 7-S Framework in tabular format, accompanied by examples to illustrate their application.         E lement Description Example Strategy The overarching plan to achieve goals Developing a market expansion strategy Structure The organization's hierarchy and design Centralized vs. decentralized structure Systems Processes and procedures for operations Implementing a new CRM system Shared Values Core beliefs and principles Commitment to customer satisfaction Skills Competencies and capabilities Technical skills in...

BCG Matrix

  Understanding the Boston Consulting Group (BCG) Matrix: A Strategic Analysis Tool Introduction: The Boston Consulting Group (BCG) Matrix is a strategic management tool developed by the Boston Consulting Group in the 1970s to help organizations analyze their business portfolio and make informed decisions about resource allocation. This matrix categorizes a company's products or services into four quadrants based on their market growth rate and relative market share. In this article, we will delve into the components of the BCG Matrix and provide an example from the industry to illustrate its application. Components of the BCG Matrix: The BCG Matrix consists of four quadrants, each representing a different strategic category: Stars: Stars represent products or services with high market share in a rapidly growing market. These products require significant investment to maintain their competitive position and sustain growth. As the market matures, stars have the potential to become ...